Every SaaS product ships a dashboard. Most of them are wrong. They surface the metrics the vendor decided were important, in the layout the vendor found easiest to build, on the cadence the vendor found cheapest to compute. Your business is different. Your decisions are different. The moment you accept a third-party admin panel as your operational view, you start making decisions through someone else's lens.
The good news: a custom dashboard is not a six-month project. With Next.js server components and Prisma, you can ship a read-only operational view of your own database in two to three focused days. It will load faster, cost less, and tell you exactly what you need to know.
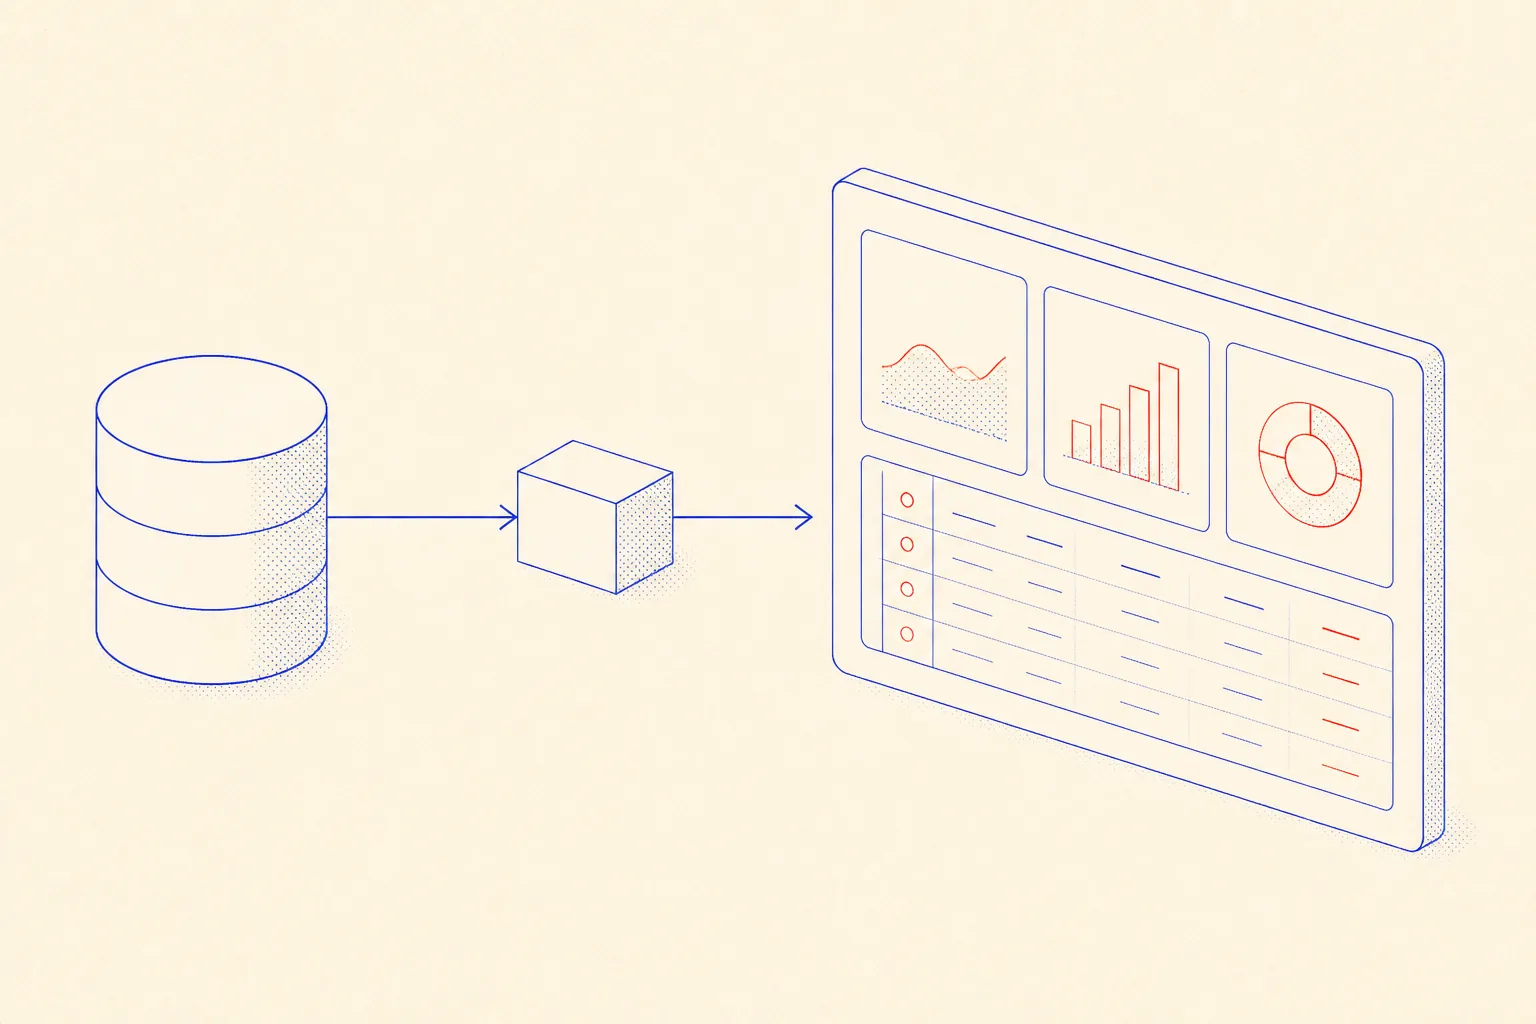
The Off-The-Shelf Trap
Tools like Retool, Metabase, and Forest Admin are genuinely useful for certain teams. They are fantastic if your data model happens to match their assumptions and your team is happy operating inside their permission model. But most product companies hit the ceiling fast. You cannot easily join three internal tables with custom business logic. You cannot embed real-time websocket data next to a slow aggregation query. You cannot enforce the same auth rules you use in your product. Every workaround adds another layer of indirection between a decision and the data driving it.
The deeper problem is ownership. When your operational view lives in a third-party tool, your team learns that tool instead of your system. New engineers spend time configuring widgets instead of understanding the domain. The dashboard becomes a black box that nobody fully trusts.
A dashboard is only useful if the person reading it trusts every number on it.
What a Thin Honest Layer Looks Like
The alternative is not a full admin framework. It is a small, read-oriented Next.js application that sits in your monorepo, shares your Prisma client, and renders only the handful of metrics and tables your operations team actually acts on. No drag-and-drop widget builder. No plugin marketplace. Just server components that run queries and return data.
The architecture is deliberately boring. A server component runs a Prisma query. The result is typed. The component renders it. There is no API route in between because you do not need one. Server components are the API. This means the data never serializes through a client boundary unless you explicitly choose to make something interactive.
- No client-side data fetching for read paths. Server components eliminate the loading spinner for most views.
- Your auth, not theirs. The dashboard lives behind the same middleware as your product.
- Typed queries. Prisma's generated client means a schema change breaks the dashboard at compile time, not in production.
- Incremental. Start with one metric panel. Add sections when someone asks for them.
A Real Server Component: Metric Panel and Table
Here is what a practical revenue overview page looks like. The component runs two Prisma queries, computes a simple delta, and renders inline. The table below it is paginated at the database level, not in memory.
// src/app/dashboard/page.tsx
import { prisma } from '@/lib/prisma';
import { formatCurrency, formatPercent } from '@/lib/format';

async function getRevenueStats() {
  const now = new Date();
  const startOfMonth = new Date(now.getFullYear(), now.getMonth(), 1);
  const startOfLastMonth = new Date(now.getFullYear(), now.getMonth() - 1, 1);

  const [thisMonth, lastMonth] = await Promise.all([
    prisma.order.aggregate({
      where: {
        createdAt: { gte: startOfMonth },
        status: 'completed',
      },
      _sum: { amountCents: true },
      _count: true,
    }),
    prisma.order.aggregate({
      where: {
        createdAt: { gte: startOfLastMonth, lt: startOfMonth },
        status: 'completed',
      },
      _sum: { amountCents: true },
      _count: true,
    }),
  ]);

  const thisTotal = thisMonth._sum.amountCents ?? 0;
  const lastTotal = lastMonth._sum.amountCents ?? 0;
  const delta = lastTotal === 0 ? null : (thisTotal - lastTotal) / lastTotal;

  return {
    thisMonthRevenue: thisTotal,
    thisMonthOrders: thisMonth._count,
    revenueDelta: delta,
  };
}

async function getRecentOrders(page = 0, pageSize = 20) {
  const [orders, total] = await Promise.all([
    prisma.order.findMany({
      where: { status: 'completed' },
      orderBy: { createdAt: 'desc' },
      skip: page * pageSize,
      take: pageSize,
      select: {
        id: true,
        createdAt: true,
        amountCents: true,
        customer: { select: { email: true } },
      },
    }),
    prisma.order.count({ where: { status: 'completed' } }),
  ]);
  return { orders, total };
}

export default async function DashboardPage() {
  const [stats, { orders, total }] = await Promise.all([
    getRevenueStats(),
    getRecentOrders(),
  ]);

  return (
    <main className="p-8 max-w-5xl mx-auto space-y-8">
      <h1 className="text-2xl font-semibold">Operations</h1>

      {/* Metric panel */}
      <div className="grid grid-cols-3 gap-4">
        <MetricCard
          label="Revenue (this month)"
          value={formatCurrency(stats.thisMonthRevenue)}
          delta={stats.revenueDelta}
        />
        <MetricCard
          label="Orders (this month)"
          value={String(stats.thisMonthOrders)}
        />
        <MetricCard
          label="Total completed orders"
          value={String(total)}
        />
      </div>

      {/* Orders table */}
      <table className="w-full text-sm border-collapse">
        <thead>
          <tr className="border-b text-left text-neutral-500">
            <th className="py-2 pr-4">Date</th>
            <th className="py-2 pr-4">Customer</th>
            <th className="py-2 text-right">Amount</th>
          </tr>
        </thead>
        <tbody>
          {orders.map((o) => (
            <tr key={o.id} className="border-b last:border-0">
              <td className="py-2 pr-4 text-neutral-400">
                {o.createdAt.toLocaleDateString()}
              </td>
              <td className="py-2 pr-4">{o.customer.email}</td>
              <td className="py-2 text-right font-mono">
                {formatCurrency(o.amountCents)}
              </td>
            </tr>
          ))}
        </tbody>
      </table>
    </main>
  );
}

function MetricCard({
  label,
  value,
  delta,
}: {
  label: string;
  value: string;
  delta?: number | null;
}) {
  return (
    <div className="rounded-lg border p-4 space-y-1">
      <p className="text-xs text-neutral-500">{label}</p>
      <p className="text-2xl font-semibold">{value}</p>
      {delta != null && (
        <p className={delta >= 0 ? 'text-green-600 text-xs' : 'text-red-500 text-xs'}>
          {delta >= 0 ? '+' : ''}{formatPercent(delta)} vs last month
        </p>
      )}
    </div>
  );
}
Two parallel queries, a typed result shape, and a render. That is the whole thing. No saga, no store, no useEffect. The component is a pure function of its data.
Performance Without Infrastructure
Dashboard pages can feel slow if every navigation triggers a full database round-trip. Next.js gives you two tools that cost nothing extra. First, React's cache function deduplicates identical Prisma calls within the same render cycle, so two components requesting the same aggregate do not fire two queries. Second, Next.js route-segment caching lets you set a revalidate export on the page. A value of 60 means the page rebuilds once per minute at the edge, not on every request.
// At the top of any dashboard page file:
export const revalidate = 60; // rebuild at most once per minute

// For a truly real-time view (operations room style), use:
export const dynamic = 'force-dynamic'; // always fresh, no caching

// Deduplicate expensive aggregations across components in the same render:
import { cache } from 'react';

export const getRevenueStats = cache(async () => {
  // ... Prisma queries
});
Choose revalidate = 60 for most operational pages. The numbers do not need to be live to be useful. Reserve force-dynamic for the one view where a 60-second lag genuinely matters, like a support queue or a fraud alert feed.
Giving an AI Agent Long-Term Memory of Your Dashboard
Once your dashboard grows past a handful of pages, an AI coding agent becomes a useful collaborator for adding new metric panels, adjusting queries, or fixing edge cases. The problem with AI agents is state: each session starts fresh, and the agent does not remember your Prisma schema, your naming conventions, or why you chose a particular query structure.
The solution is a markdown memory file committed to the repository. When the agent reads this file at the start of a session, it has the full operational context of your dashboard without you needing to re-explain it. Tools like Claude Code read an AGENTS.md file automatically. Others can be pointed at a file in their system prompt or context window.

Here is a minimal but complete example of what that memory file looks like for a dashboard project. The key is to be concrete and specific: schema field names, file paths, the exact commands that run the dev server, and the gotchas you have already hit.
# AGENTS.md, Dashboard Project Memory

## What this repo is
Internal operations dashboard for Jumpino. Read-only views over the production
Postgres database via Prisma. Next.js 15 App Router, TypeScript strict mode,
Tailwind CSS for layout only (no component library).

## Database
- Prisma schema lives at `prisma/schema.prisma`.
- The `Order` model uses `amountCents: Int` (not a float). Always format with
  `formatCurrency(cents)` from `src/lib/format.ts`.
- `customer` is a relation on `Order`, not a field. Use a `select` or `include`
  in every query that needs the email.
- Never run migrations from this repo. Schema changes happen in the main API
  repo and are pulled via `npx prisma db pull`.

## File structure
- Dashboard pages: `src/app/dashboard/**`
- Shared queries (used by 2+ pages): `src/lib/queries/`
- One-off page queries: keep inline in the page component
- Formatting utils: `src/lib/format.ts`

## Commands
- Dev server: `pnpm dev` (port 3001, main product runs on 3000)
- Type check: `pnpm tsc --noEmit`
- No tests yet; manual verification only

## Conventions
- All dashboard pages export `revalidate = 60` unless they need live data.
- Use `Promise.all` for parallel queries; never await in sequence inside a loop.
- MetricCard component lives in `src/components/MetricCard.tsx`; import it,
  do not rewrite it.

## Known gotchas
- `createdAt` on Order is stored in UTC; display in the user's local timezone
  via `toLocaleDateString()`, the server does not know the browser timezone.
- Prisma `aggregate` returns `null` for `_sum` when there are no rows. Always
  use the nullish coalescing pattern: `result._sum.amountCents ?? 0`.
When you update the schema, add a gotcha, or introduce a new convention, you update this file. The agent picks it up on the next session. This is not complicated tooling: it is a text file that you maintain the same way you maintain a README. The difference is that an agent can act on it reliably, while a human might skip reading it.
When to Add More
Start minimal. A metric panel and a paginated table cover 80% of operational decision-making for most early-stage products. The questions to ask before adding a new section are: who will act on this number, and what action will they take? If the answer is vague, the metric does not belong in the dashboard yet.
The natural additions, roughly in order of value: a search input over the orders table (a single server action with a query param), a date range picker to scope aggregations, and an export button that streams a CSV directly from Prisma. Each of these is a few hours of work, not a few days, because the foundation is already right.
- Search: Pass a
qquery param to the page, add awhere: { customer: { email: { contains: q } } }clause to the Prisma query. - Date range: Two
<input type="date">fields driving query params on the server component. - CSV export: A route handler at
GET /dashboard/orders.csvthat streams Prisma results through a simple serializer. - Charts:
rechartswith a client component wrapper is the lowest-friction option; keep the data fetching on the server and pass it as props.
The goal is not to build a product. The goal is to build a tool that your operations team trusts, that your engineers can modify in an afternoon, and that surfaces exactly the information needed to make the next good decision. That is achievable in days. It just requires resisting the pull toward a framework that promises everything and delivers noise.